
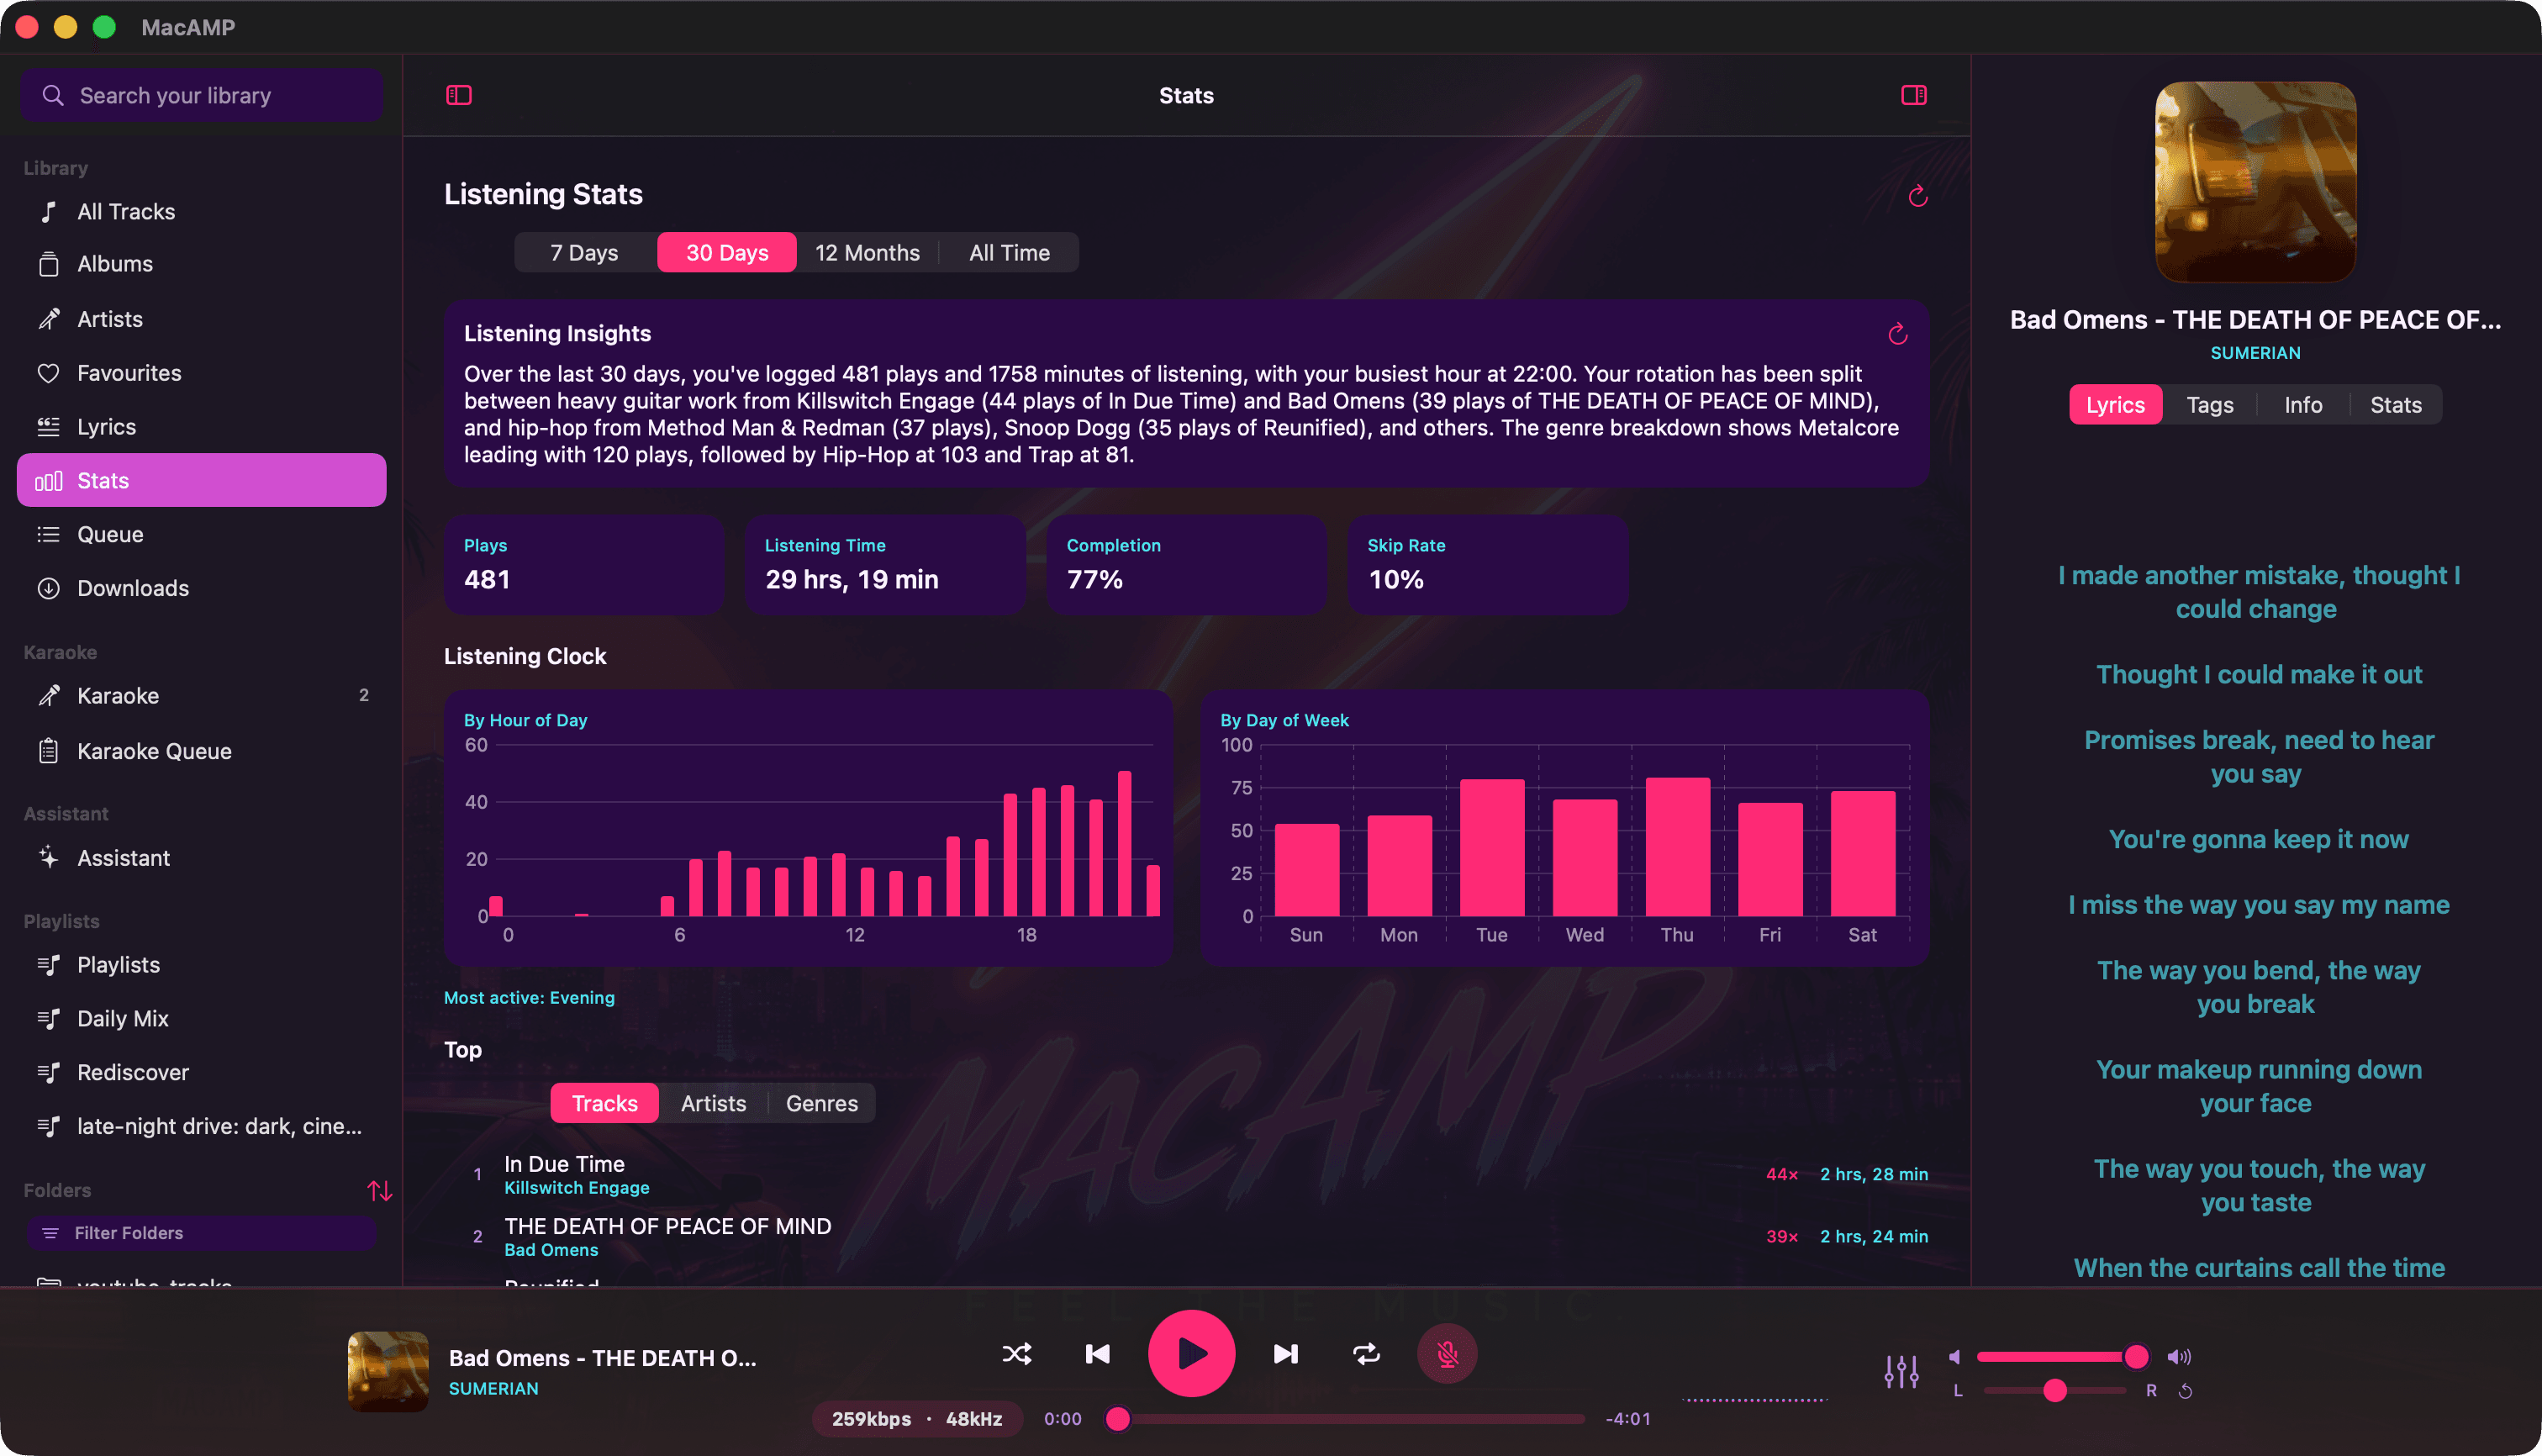
The dashboard at a glance
Open Stats in the sidebar and pick a window: 7 days, 30 days, 12 months or all time. Switching is instant because all four are loaded at once.
At the top sit four numbers that tell you a lot in a second:
| Card | What it tells you |
|---|---|
| Plays | How many tracks you started in the window. |
| Listening Time | Real time spent listening, not track lengths added up. |
| Completion | On average, how much of a song you hear before moving on. |
| Skip Rate | The share of plays you cut short. Under half a song, started by you, counts as a skip. |
Listening Insights
If you’ve switched on the assistant, the dashboard opens with a few sentences written from your numbers: your busiest hour, who dominated the month, how your genres split. It reads like a friend summarising your month, and it’s generated from your stats summary only. Your files never leave the Mac.
The listening clock
Two bar charts show when you listen: by hour of the day and by day of the week, with a caption like Most active: evening. Times are stored with your local offset at the moment of each play, so “late night” means your late night, even if you travel.
Top tracks, artists and genres
A small switch flips between your most-played tracks, artists and genres for the window, each with a play count and total time. Double-click any track that’s still in your library and it starts playing.
Most Replayed: the heatmap
This is the one that surprises people. While a song plays, MacAMP notes where the playhead is once a second. Over time that builds a heatmap of 100 slices per track, showing which parts you actually hear and which ones you keep rewinding to.
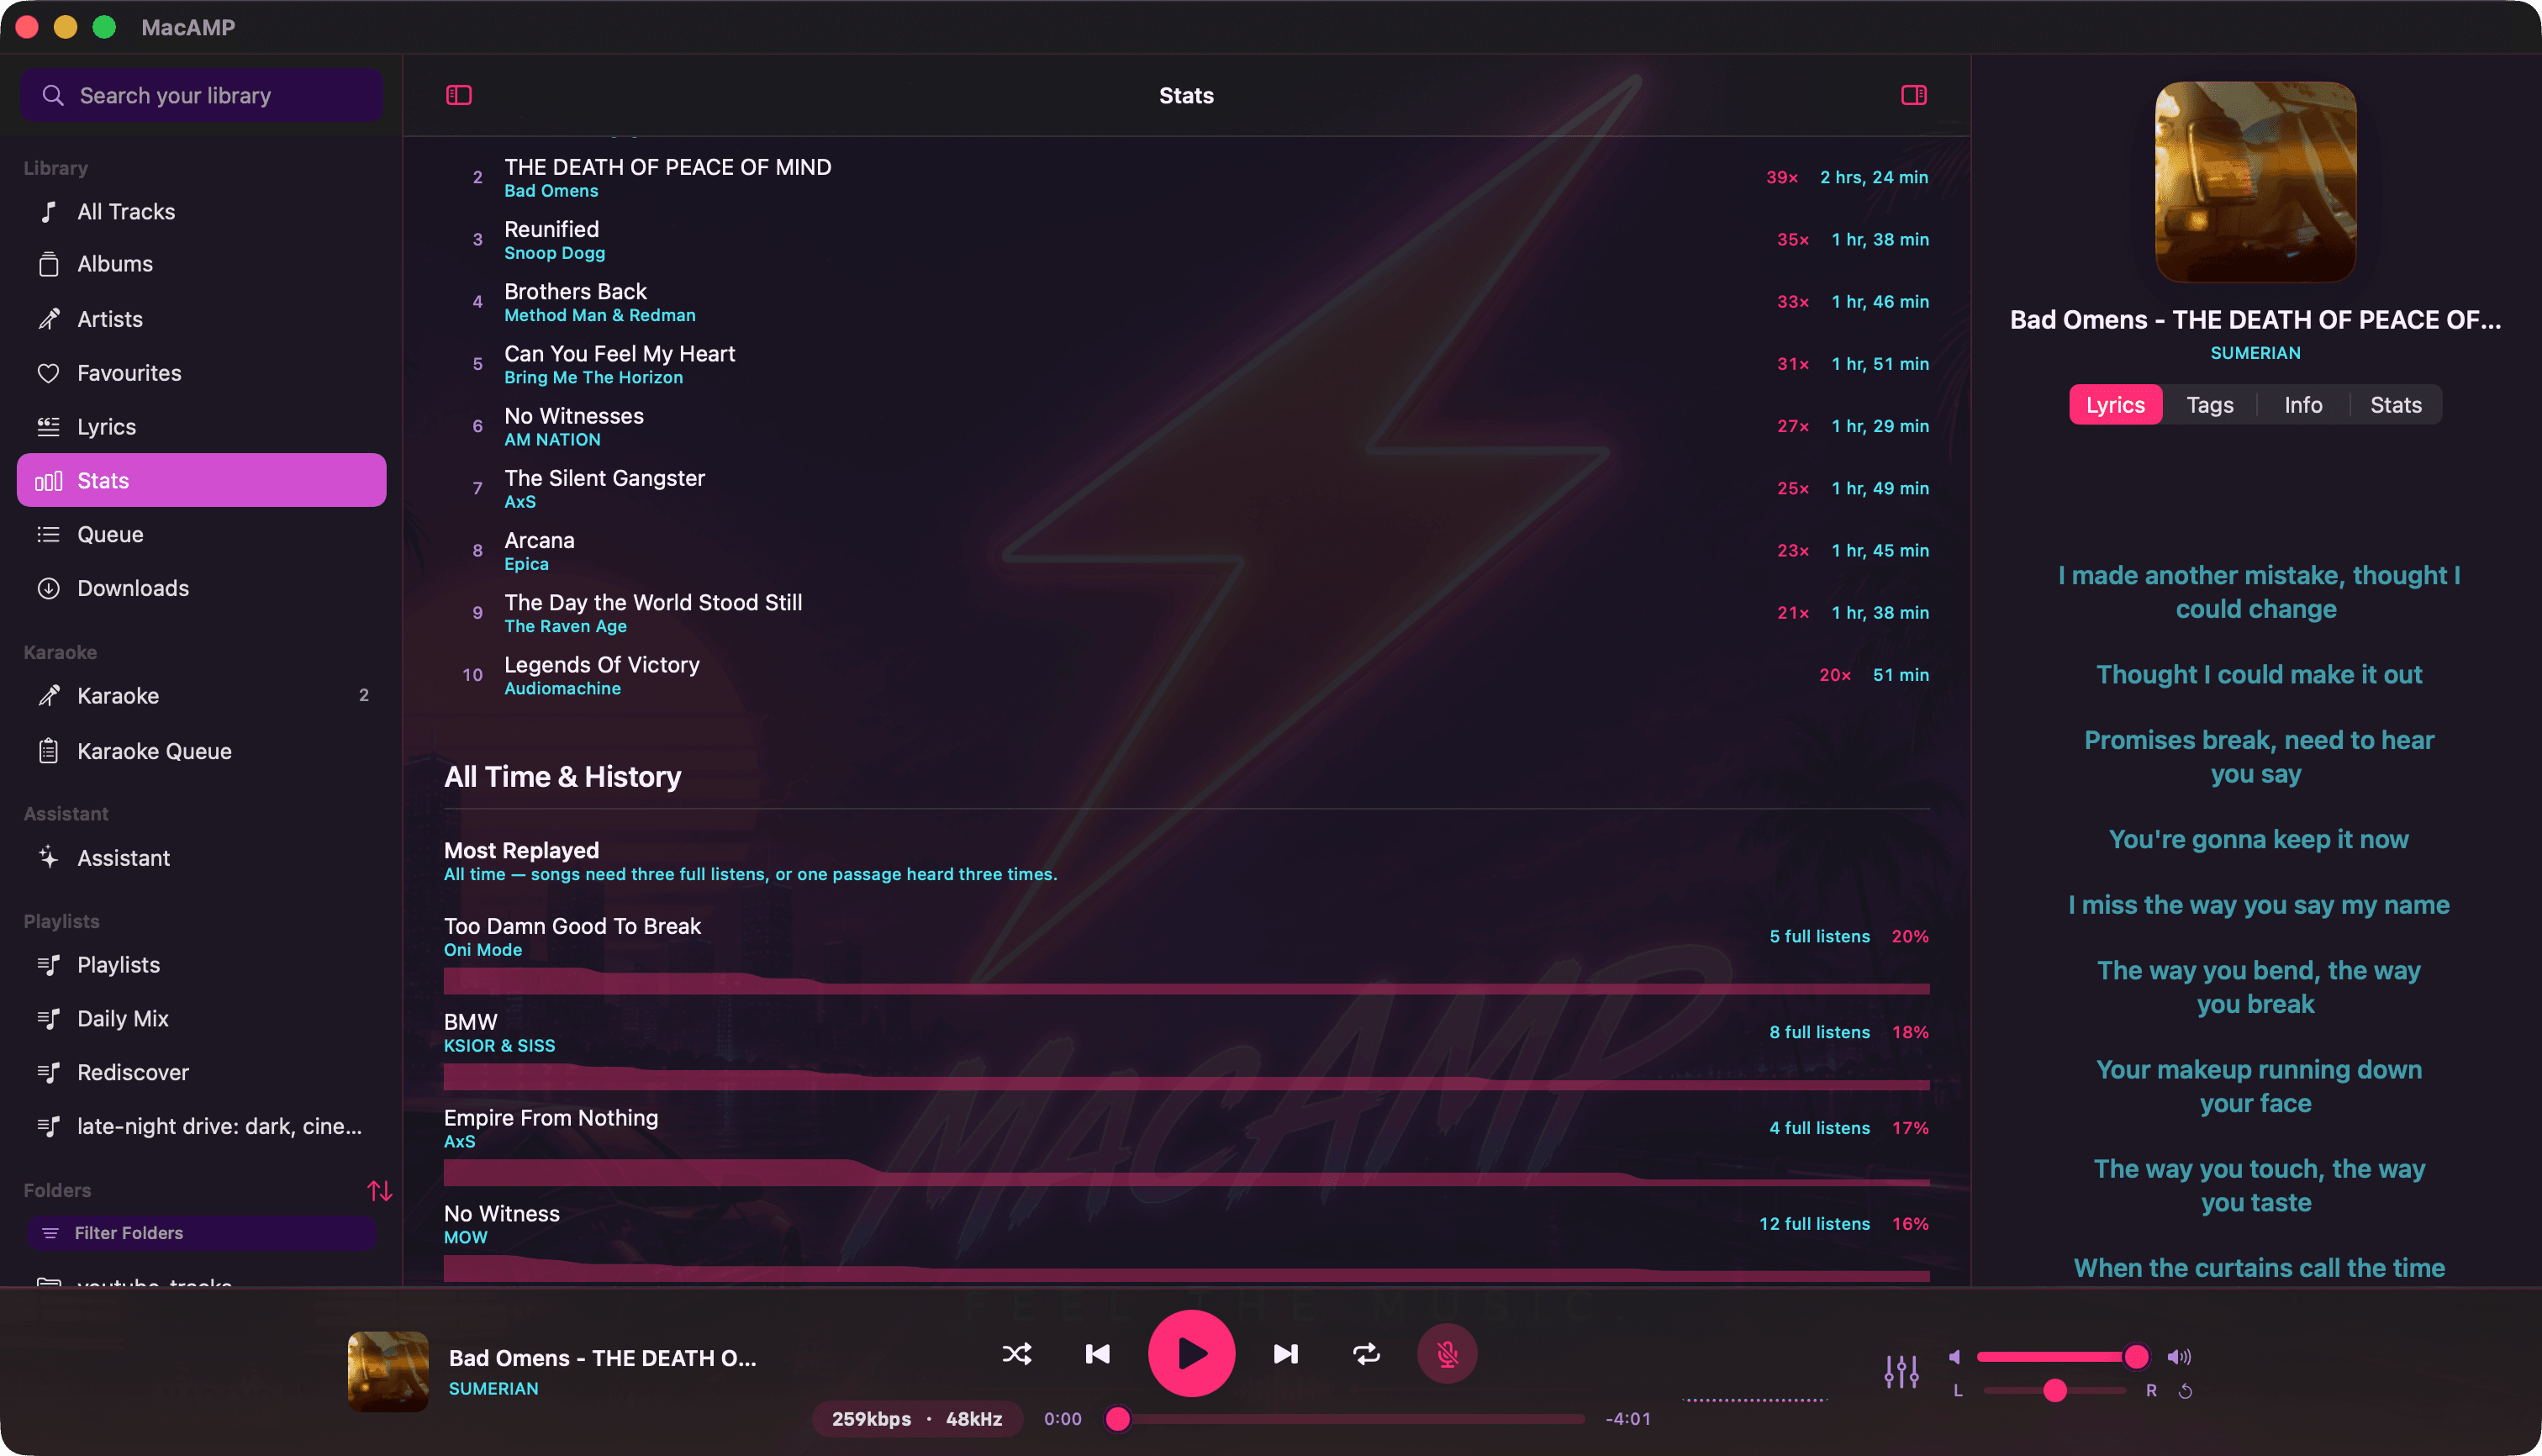
You’ll find the curve in five places: behind the player-bar scrubber when you hover, in the full player, in the expanded Now Playing view, in the menu-bar mini player and in the Stats tab of the right panel. It only appears once there’s real evidence, meaning three full listens or one passage heard three or more times. A track you’ve played once won’t sprout a fake curve.
History that survives clean-ups
Each play stores a small snapshot of the track: title, artist, album and genre. Delete the song, rename the folder or unplug the drive, and your history still adds up.
- of play-by-play detail
- 24 mo
- monthly artist and genre totals
- ∞
- recent plays, newest first
- 50
After 24 months, detailed plays are folded into permanent monthly totals per artist and genre. Your all-time top artists never reset.
Take your stats with you
Export a profile from Settings › Profiles and you get a single .macampprofile file with your plays, monthly totals, heatmaps, favourites and play counts. Settings and EQ presets are optional. Import it on another Mac and MacAMP matches tracks by title, artist, album and duration.
Per profile
Every profile has its own stats. Your partner’s 3 a.m. lo-fi phase won’t end up in your charts.